Category Archives: Programming

Distance Matrix in R

I’ll do an exercise to make a distance matrix, for that we only need the function spDistN1 from the library “sp”. 

The basic use of the function is the following:

library(sp)
data(meuse)
coordinates(meuse) <- c("x", "y")
spDistsN1(meuse, meuse[1,], longlat=TRUE)

The limitation this is it only return the distance of the first element (or given row), because what the function does is to measure the distance of all the elements in relation with only one geometric element (meuse[1, ]) . To solve that we can use the apply function:

apply(meuse@coords, 1, function(x) spDistsN1(meuse@coords, x, longlat = T))

This is a great solution, but the issue is when the data is too big. In that case it will take too much time to process. (Imagine the case I do this with a for loop instead of apply, it would be much slower than now).

To solve the aforementioned problem I must to process with parallelization and as you can guess, the function parApply is just like apply but with parallelization development on it:

library(sp)
library(parallel)
m.coord <- meuse@coords
ncore <- detectCores()
cl <- makeCluster(ncore)
clusterExport(cl, c("m.coord"))
clusterEvalQ(cl = cl, expr = c(library(sp)))
parApply(cl = cl, X = m.coord, MARGIN = 1, 
FUN = function(x) spDistsN1(m.coord, x, longlat = T))
stopCluster(cl)

Then we have a nice and an efficient solution.

Note: I know it can be easily done with a GIS software, but in this way it
can be incorporated in a bigger and automatized process.
Nearest Facility

I haven’t blogged since a long long time, on this opportunity I want to show a very simple way to obtain the nearest centroid.

Let’s imagine there is a group of markets in a town and they need to obtain their supply at the nearest  supermarket.

With the help of a GIS Software, any facility has their geographical position and consecutively we can obtain a distance matrix. We assume that the supply only comes from only one supermarket. With this elements at hand we can make a code in R.

First of all to be a reproducible example we simulate a distance matrix. For this I can create and bring a matrix to a data frame. As we’ll on the code, I’m assuming that the random distances have a normal distribution.

As the output of a distance matrix of a GIS is tabular and it has not as a matrix , I have to convert the matrix to tabular data, for that I need to use the gather function found in the dplyr library.

Dist_mtx <- as.data.frame(matrix(abs(rnorm(100, mean = 1000, sd = 800)), nrow = 20))
names(Dist_mtx) <- seq(1:5)
Dist_mtx$O <- seq(10000, 10019, 1)
library(dplyr)
Dist_mtx <- gather(Dist_mtx, key = D, value = DIST, 1:5)
Dist_mtx <- Dist_mtx[order(Dist_mtx$O),]

After that there is the need to create a function with three parameters, we'll call her DistMin_Cent.

DistMin_Cent <- function(DF, Destination, Distance){
}

For this function we will need the libraries dplyr and tidyr because there is the need to transform the tabular data into a matrix form. This need of this transformation exist to extract the closest supermarket, this is with the spread function.

DF <- spread_(DF, Destination, Distance)

To extract the min distance we need the apply function, inside this function we need to set the argument MARGIN = 1, this is necessary to do the calculation per row.

DF$MIN <- apply(DF[, c(2:ncol(DF))], 1, FUN = min)

The following code helps to obtain to identify the name of the column which has the minimum distance.

c_col <- c(ncol(DF)-1)
DF$CName <- as.numeric(colnames(DF[, c(2:c_col)])[apply(DF[,
c(2:c_col)], 1, which.min)])

After that we select only the columns is useful for us.

All is summarized in a the new function to be capable of doing this with any data frame.

DistMin_Cent <- function(DF, Destination, Distance){
library(dplyr)
library(tidyr)
DF <- spread_(DF, Destination, Distance)
DF$MIN <- apply(DF[, c(2:ncol(DF))], 1, FUN = min)
c_col <- c(ncol(DF)-1)
DF$CName <- as.numeric(colnames(DF[, c(2:c_col)])[apply(DF[,
c(2:c_col)], 1, which.min)])
DF <- DF[, c(1, ncol(DF), c_col)]
rm(c_col)
names(DF) <- c("PA", "PB", "DIST")
DF
}

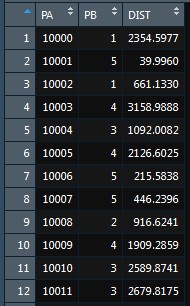
DistMin_Cent(Dist_mtx, "D", "DIST")

And then we can see the results of the process.

min_dist

Writing multiple csv files from a xlsx

What I used for this example is an open data about “Recycling places”, you can find it on the web page of Portal de datos Públicos.

The data, is an xlsx file

xlsx_wordpress

The file has 8 columns, one of them is town. So, now, the questions is:

How do I generate multiple files, one for each town?. The answer is simple: R

Why R? Because, you can automatize it. It avoid you to make different filters, and save the new file each time.

Let’s start:

To read the file, you can use the XLConnect package, and to split the data: the plyr package.

You can load the file with the function readWorksheet, but, as you can see, on the first row, six of the eight cells, are merged. So, when you load the file, that will disappear. Thus, we will read the file with headers and we’ll rename the columns with troubles; and then we will remove the row without data.

After that, we will use the d_ply function, which lets us to split the data. On this function, we put the field on which the split should be based. Then, we use the sdf function, which allows us to write the csv files; and as a final step, we extract the names from the field chosen, to paste them on the name of the new files.

library(XLConnect) #Functions to read excel
library(plyr) #Functions to split data

wb = loadWorkbook("Formato_Puntos_de_almacenamiento_Muni_consolidado.xlsx")
df = readWorksheet(wb, sheet = "Hoja1", header = TRUE)
colnames(df)[c(5, 6)] <- c("Este UTM", "Norte UTM")  #change col names
df2 <- df[-1,] #remove first row

d_ply(df2, .(Comuna),
      function(sdf) write.csv(sdf,
                              file=paste(sdf$Comuna[[1]],".csv",sep=""))) #write multiple csv

A DBI for PostgreSQL on R

Between the capabilities of R there is the possibility of querying databases thorough R. The DBMS that I know more it’s PostgreSQL. What I like about it, that it is an open source object-relational DBMS. It’s so simple, an also it has an extension for Spatial and Geographical objects called PostGIS.

Thus, the DBI (Database Interface) package I’ve chosen for querying PostgreSQL is RPostgreSQL. To work with it, just I have to download the package from the Repository and use the following code:

library(RPostgreSQL)

drv <- dbDriver("PostgreSQL")
con <- dbConnect(drv, host = "localhost", user= "***", password="***", dbname="Procesos_UChile")

dbListConnections(drv)
dbGetInfo(drv)
summary(con)

df = dbReadTable(con,'etapas_sept_2013')
summary(df)
head(df, 3)
dbDisconnect(con)

This DBI is a nice product, but it’s limited by the ram, this problem appears when I tried to read a table over 10GB. So, I’m stuck on here. I know, this year was released a library called PivotalR, which allows you to manage big amounts of data with the library madlib.

Pivotal is a software company that provides software and services for the development of custom applications for data and analytics based on cloud computing technology.

And they made a an open-source library for scalable in-database analytics that provides data parallel implementations of mathematical, statistical and machine-learning methods for structured and unstructured data called Madlib.

The next step is trying to installing this library on ubuntu to see how it works. The instructions are on this URL:

https://gist.github.com/thinkerbot/8699369

You can also watch a presentation of PivotalR with a demo on the following video:
https://www.youtube.com/watch?v=6cmyRCMY6j0

My First Post

The motivation of this blog, is because I'm on the process of learning R. I studied Geographical Engineering, we always used softwares, but we never saw R, not even for doing some stats; so I didn't know what it was.
When I had to do the thesis a teacher told me to do everything on R; so, thence I knew how amazing it is. Though, still I'm a beginner.
A couple of months ago, I watched some videos from R-bloggers; there some R gurú told that the best way to learn is doing a blog. So, here I am; and, also it has a double purpose, because it will help me to improve my writing skills.

For posting this, I'm using R, just I followed the excellent code from William K. Morris’s Blog.